"The Market Went Up Today" — But Did Your Portfolio?
You hear it every evening. The S&P 500 was up 1.2% today. The Nasdaq gained. The Dow closed higher. And somewhere between the news segment and dinner, most investors translate that sentence into a different one: my portfolio went up today.
The assumption is understandable. It is also almost always wrong — and the degree to which it is wrong depends on something almost no financial news coverage bothers to explain: what "the market" actually contains, who drives its movement, and what that means for the specific securities sitting in your account.
What "The Market" Actually Is
The U.S. stock market is not a monolith. It is approximately 4,000 to 5,000 publicly traded common stocks — down from a peak of more than 7,000 listings in the late 1990s. Every major index — the S&P 500, the Dow Jones Industrial Average, the Nasdaq Composite — is built from a subset of this pool. Every mutual fund, ETF, and 401(k) menu draws from it too.
The S&P 500, the index most people mean when they say "the market went up," is 500 companies. But it is not an equally weighted average of those 500. It is market-capitalization weighted — which means the largest companies by total stock value move the number far more than smaller ones. When the five or ten largest components move sharply, the index moves. The other 490 companies may have done nothing — or gone in the opposite direction.
A 1% move in the S&P 500 can happen on a day when hundreds of its underlying stocks go nowhere, or fall. The headline is a cap-weighted composite. It does not describe the median stock's behavior, and it does not describe your portfolio unless your portfolio is a precise replica of the index's composition and weightings.
The Research That Changes How You Read a Market Update
In 2018, Professor Hendrik Bessembinder of Arizona State University's W. P. Carey School of Business published a paper in the Journal of Financial Economics titled "Do Stocks Outperform Treasury Bills?" The question sounds rhetorical. The answer is not what most investors expect.
Bessembinder and his team studied the complete history of U.S. common stock returns from 1926 through the present — approximately 29,000 publicly listed companies over that span. The average listed life of a company was 11.6 years. Most companies, by the time they were delisted, had not existed long enough to build substantial long-term returns for shareholders.
Source: Bessembinder, "Do Stocks Outperform Treasury Bills?" Journal of Financial Economics (2018), Arizona State University, W. P. Carey School of Business — updated in subsequent research.
The Finding: A Very Small Number Did All the Work
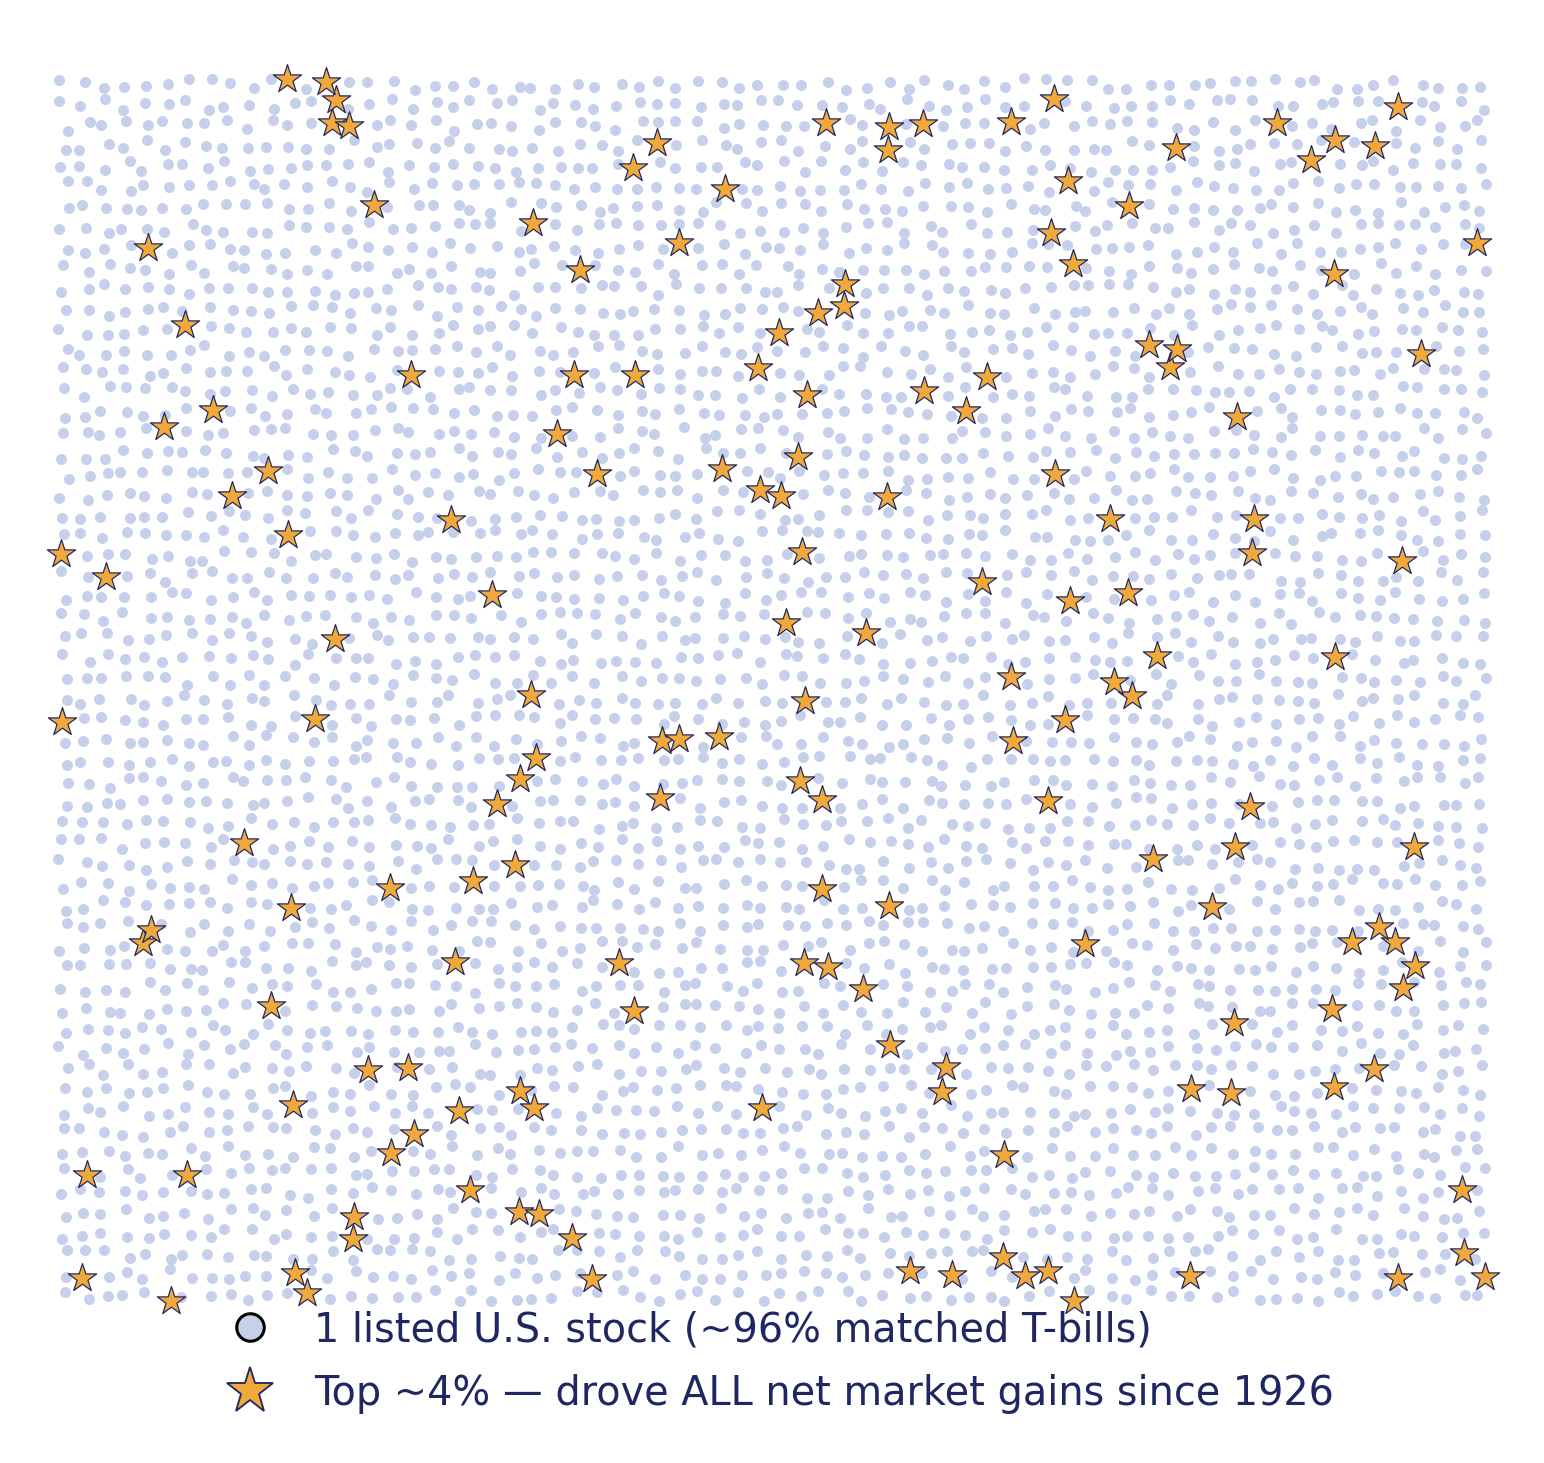
Here is the central result: 100% of net wealth created by the U.S. stock market above one-month Treasury bill returns since 1926 came from roughly 4% of the stocks ever listed.
The other 96% of listed companies — collectively, across their entire listed lifetimes — matched T-bill returns. That is not a typo. The vast majority of stocks that have ever traded on a U.S. exchange produced no net wealth above what an investor could have gotten from a risk-free government instrument. Some outperformed briefly. Most didn't. Collectively, they washed out.
The wealth creation was real — but it was extraordinarily concentrated. A handful of companies — Apple, Microsoft, ExxonMobil, General Electric, IBM and a few dozen others over the decades — produced the long-run returns that justify equity investing as an asset class. The rest of the market, in aggregate, was a wash.
The Median vs. the Mean: Two Very Different Stories
This divergence between median and mean is the mechanism behind the entire finding. The average stock did well — but only because averages are pulled toward outliers. The typical stock, defined by median outcome, lost money on an annualized basis over its listed life.
This is a mathematical property of positively skewed distributions, not a statement about any particular era of markets. When a small number of extreme winners coexist with a large number of modest losers, the mean rises while the median falls. That is the stock market's actual return distribution — and it has been for nearly 100 years of data.
"Stocks go up over time" is true in aggregate and at the index level. It is not true at the individual stock level. If ~96% of companies that ever listed produced no net wealth above T-bills, "most stocks go up over time" fails on the data. The long-run positive return is real — but it is produced by a specific handful of names, not by stocks as a broad category.
Why the Headline Number Moves on So Few Names
Three mechanics reinforce each other to produce the headline-vs-reality gap:
1. Indexes are weighted, not averaged. The S&P 500 and Nasdaq are cap-weighted. A company worth $3 trillion moves the index dramatically more than a company worth $3 billion. The top 10 holdings in the S&P 500 have at times represented more than 30% of the entire index's weight. When those 10 move, the number moves. The other 490 are largely along for the ride.
2. The biggest names repeat. The same handful of dominant companies that drive today's daily index moves are the same handful driving Bessembinder's long-run wealth numbers. This is not coincidence — it is causation. The companies that became the largest by market cap did so because they generated extraordinary returns over long periods. The concentration of the index and the concentration of wealth creation are the same phenomenon measured at different time horizons.
3. One number, thousands of outcomes. On any given day, a 1% rise in the S&P 500 is consistent with hundreds of individual stocks declining. The index absorbs this internal dispersion and reports a single composite. The composite tells you something real — but it does not tell you what happened to most of the underlying components.
Unless you hold a true total-market index fund — one that owns every listed stock in proportion to its market cap — your portfolio's exposure to the few index-moving names is either diluted or concentrated relative to the index. An actively managed mutual fund that underweights Apple and Microsoft while owning a broader set of mid-caps will diverge from the S&P 500 even on days when the index moves cleanly in one direction. A portfolio of individual stocks picked to "beat the market" is making an implicit bet that it has found the 4% — without knowing which 4% it is in advance.
Three Things This Means for Your Retirement Plan
The Bessembinder research is an academic finding about historical stock returns. Its practical implications are significant:
Your account isn't "the market." Unless you hold a true total-market index fund, the gap between the index's return and your portfolio's return is not noise — it is a structural feature. The index is weighted toward the companies that have already become dominant. Most portfolios are not.
Stock-picking odds are worse than they feel. If roughly 96% of everything ever listed has historically produced no net wealth above T-bills, identifying the 4% in advance is not a skill that can be reliably demonstrated over time. The research on active fund manager performance is consistent with this: the majority of actively managed funds underperform their benchmark over long periods, and the ones that outperform in one decade rarely sustain it in the next.
Headlines compress an enormous amount of dispersion. "The market went up" is a statement about a weighted composite of a fraction of all available stocks. It is not a statement about "stocks" as a category, and it is not a statement about your account. Both of those things require more specific information — information that the evening news doesn't provide.
Bessembinder's conclusion is not that equities are bad. It is that the long-run case for equities rests almost entirely on broad, diversified exposure — specifically on the probability of capturing the small percentage of names that will generate the outsized returns. "Own broadly" is the lesson. But hold onto the insight: the next time you hear "the market went up," ask yourself whether what you own actually moved with it — and whether you have any reliable way of knowing in advance which stocks will be in the 4%.
What This Has to Do With Certainty
At 82 Financial, we build retirement income strategies that are independent of which stocks end up in the 4%. Not because we believe equity markets will fail — they haven't over the long run — but because retirement income has a different requirement than wealth accumulation: it needs to be predictable.
A retiree drawing income from a stock portfolio is not asking "will the market go up over the next 30 years?" They are asking "will my account have money in it the year I need to draw from it?" Those are different questions. The first has a historically positive answer. The second is subject to sequence-of-returns risk, concentration risk, and the simple fact that the median stock in the Bessembinder data lost money — which means more than half of what you might own at any given time is, statistically, not carrying its weight.
Certainty in retirement income does not come from predicting which stocks win. It comes from structures that do not depend on that prediction. That is the conversation worth having before the next market update tells you the S&P 500 had another good day.